How much does run differential really matter?
- Chris Blake

- Oct 29, 2021
- 3 min read
I can’t even trace the run differential argument back to its roots, but I do know that I’ve defended the merits of the statistic for quite some time now, and I’ve had it up to here (imagine me holding my hand up high — like an amusement park employee describing how tall someone needs to be to ride a ride — to express my level of discontent). I won’t name names, but some of my fellow Good Griefs writers have tried to tarnish the statistic too much for my liking. Well, I’m here — along with the data — to tell my side of the story: Run differential is a meaningful statistic in baseball when assessing how good a team really is.

The plot above shows a strong correlation (r=0.94) between end of season run differential and end-of-season win percentage for the 2021 MLB season (end of season as in end of regular season). The correlation coefficient, or “r”, ranges from -1 to 1, with -1 indicating a perfect negative correlation, 0 indicating no correlation and 1 indicating a perfect positive correlation. Needless to say, the correlation coefficient of 0.94 that we see here is extremely telling. The green line is the line of best fit. In summary, at the end of the season, teams with higher run differentials tended to have higher win percentages. This is in no way predictive; statistics teachers always stress, “Correlation does not imply causation.” However, it is interesting to see the data plotted out.
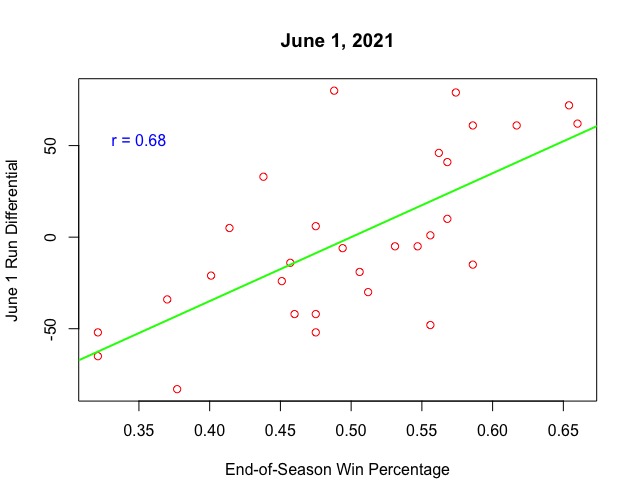
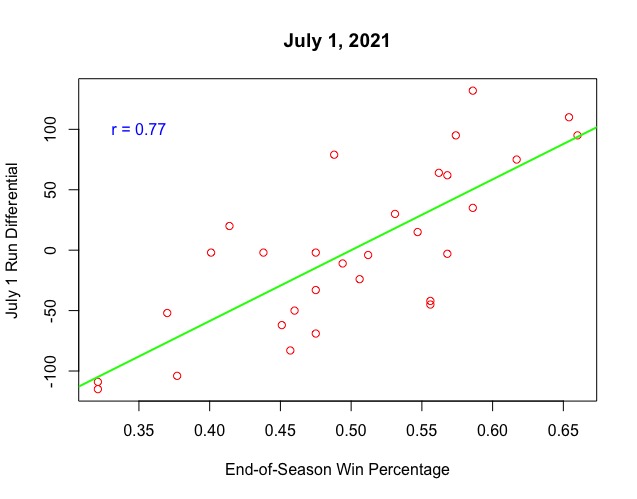
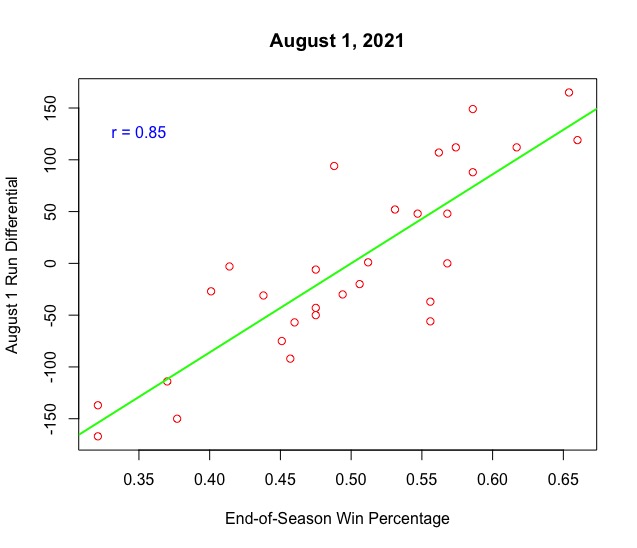
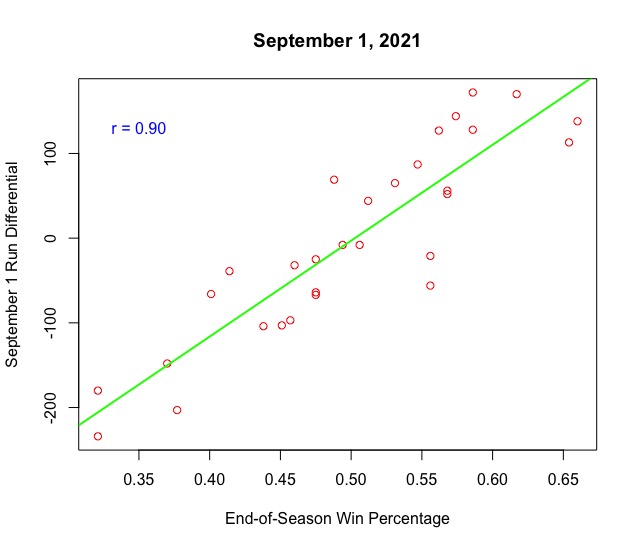
But there’s a problem. As sports fans, we argue throughout the entire season. We don’t often debate who the good teams are at the end of the season because we typically know by then. We argue in May and June about if Team X is “legit” or if Team Y is “just hot.” So I went back and looked at teams’ run differentials at the beginning of May, June, July, August and September and compared it their end-of-season win percentage for the 2021 MLB season.
If you’re curious, the team with a -60 run differential on May 1 and an end-of-season win percentage of .475 is the Detroit Tigers.
You can see the points tighten around the line of best fit each time we get a month further into the season. This is reflected by the increasing r values, showing greater and greater correlation the further we get into the season. It should come as no surprise that as we get closer to the end of the season, run differential is correlated more and more with end-of-season win percentage.
The next plot illustrates this point, showing the change in correlation between end-of-season win percentage and run differential on May 1, June 1, July 1, Aug. 1, Sept. 1 and Oct. 3, the end of the 2021 season.

Even the lowest correlation, an r value of 0.52 that we get on May 1, is still quite strong.
If you’re still not convinced that run differential is meaningful, the following are the last 10 World Series winners and where their end-of-season run differentials ranked in MLB: 2020 Dodgers (first), 2019 Nationals (sixth), 2018 Red Sox (second), 2017 Astros (third), 2016 Cubs (first), 2015 Royals (fifth), 2014 Giants (ninth), 2013 Red Sox (first), 2012 Giants (10th) and 2011 Cardinals (eighth). On average, the last 10 World Series winners finished the season with between the fourth and fifth-best run differential in MLB.
That’s all, the end of my 572-word rant on run differential. In the end, better teams tend to score more runs than their opponents to a greater degree than worse teams do.
Out of pure curiosity, I looked at which of the four major sports had the highest correlation between run/point/goal differential and end-of-season win percentage/point total, so I calculated that and made some plots. For consistency, I used data from the last full seasons for MLB (2021), the NHL (2018-19) and the NBA (2018-19), and data from the 2019-20 NFL season, since the most recent full NFL season was impacted by COVID to a high degree.


Comments